Longitudinal data on the NIH PI population (UPDATED)
March 8, 2014
Jocelyn Kaiser at ScienceInsider has obtained data on PI numbers from the NIH.
Nice.
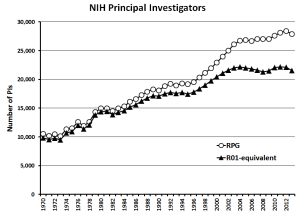
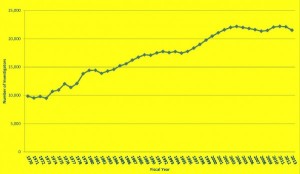
I think this graph should be pinned up right next to Sally Rockey’s desk. It is absolutely essential to any attempts to understand and fix grant application success rates and submission churning.
UPDATE 03/12/14: I should have noted that this graph depicts PIs who hold R01-equivalent grants (R01, R23, R29, R37 with ARRA excluded). The Science piece has this to say about the differential from RPG:
NIH shared these data for two sets of grants: research project grants (RPGs), which include all research grants, and R01 equivalents, a slightly smaller category that includes the bread-and-butter R01 grants that support most independent labs.
 But if you read carefully, they’ve posted the excel files for both the R01-equivalents and RPG datasets. Woo-hoo! Let’s get to graphing, shall we? There is nothing like a good comparison graph to make summary language a little more useful. Don’t you think? I know I do….
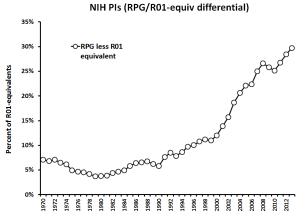
A “slightly smaller category” eh? Well, I spy some trends in this direct comparison. Let’s try another way to look at it. How about we express the difference between the number of RPG and R01-equivalent numbers to see how many folks have been supported on non-R01/equivalent Research Project Grants over the years…
 Well I’ll be hornswaggled. All this invention of DP-this and RC-that and RL-whatsit and all the various U-mechs and P01 (Center components seem to be excluded) in recent years seemingly has had an effect. Sure, the number of R01 equivalent PIs only slightly drifted down from the end of the doubling until now (relieved briefly by the stimulus). So those in NIH land could say “Look, we’re not sacrificing R01s, our BreadNButter(TM) Mech!”. But in the context of the growth of nonR01 RPG projects, well….hmmm.

March 8, 2014 at 6:26 am
Let’s hope the stimulus bump was the end of increases and that the decline continues.
LikeLike
March 8, 2014 at 7:30 am
Cull! Cull! Cull! Cull!
LikeLike
March 8, 2014 at 9:59 am
Of course it is going to decline. Grants awarded are already down to the bone.
LikeLike
March 8, 2014 at 1:29 pm
Not at all Pinko. Clearly you haven’t been listening to the people proposing that NIH should limit their awards to $50K per year.
LikeLike
March 8, 2014 at 1:45 pm
Which isn’t a big problem, DM, if salaries are cut out of the grants. We have a tradition here in the U.S. of including personnel costs as an integral part of proposals. In Europe, the project and personnel costs are often decoupled. Every lab and project seems to require a bunch of different revenue streams, but the proposals are shorter and the overall funding is more stable. In that regard, I like the European funding system way better. If only they didn’t have such weird institutional politics. And the weather kind of sucks there (except I guess in the South, but those countries are broke). And pay for PIs is generally better here in the U.S. But honestly I think it might be easier to do science in Europe these days. We might be in for a reverse 1930s brain drain. Maybe that’s where the 1000 fewer NIH applicants went? Back home. Can’t blame them.
LikeLike
March 8, 2014 at 3:34 pm
I want to see that graph, broken down by investigator age by decades. So we can see explicitly the 70+ group’s effects.
LikeLike
March 8, 2014 at 3:36 pm
70plus? Gulp.
LikeLike
March 8, 2014 at 5:32 pm
Herd-thinning usually occurs at the ends of the age distribution…that’d be my guess here. Would really, really, like to see it broken down that way,too.
LikeLike
March 8, 2014 at 7:09 pm
The longitudinal data on investigators was previously published a few years ago including a breakdown by age: http://nexus.od.nih.gov/all/2012/02/13/age-distribution-of-nih-principal-investigators-and-medical-school-faculty/ There is a link in the comments section to the raw data. There is clearly more investigators in the 70+ range compared to the early 80’s, but it’s still a very small percentage
LikeLike
March 8, 2014 at 8:27 pm
Extrapolating from the graph at bsci’s link, the number of NIH-funded PI’s that are 66+ could be 10%.
LikeLike
March 9, 2014 at 7:31 am
I suspect (hope) that most of the attrition has been among younger investigators. I don’t have anything against young investigators (I’m relatively young). But there should be some sort of positive correlation between length of time in the system and funding success, right? If there isn’t, it suggest that experience doesn’t matter. Experience should matter in a meritocracy, right? Otherwise, we might as well just hand out NIH grants to random social security numbers.
My prediction: I think older people will still be in the system because they probably know what they’re doing. Younger people are dropping out because many weren’t really qualified in the first place. It’s just like any bubble. When the housing bubble burst, some houses held decent value because they were always worth it. Some houses were never worth what people bought them for, and those are ones that are still empty or went into default. Some institutions bought up property (hired people) that didn’t really have the value they thought, in the mad grab to turn a profit. They lost on that investment. Empty labs, startups down the drain, dejected people out of a job. It’s not NIH’s fault; it’s the fault of the greedy department heads and deans desperate to manage little biomedical empires. They are failing. The classy old neighborhoods still have the same caché. Funding rates at JHU, UCSF, HMU, etc are as high as ever.
LikeLike
March 9, 2014 at 9:39 am
Good link bsci. Check how dense the 60-65 year old group was four years ago. I bet the herd thinning has been only self inflicted there…now, four years later, could be more like 12-15% over 66.
LikeLike
March 9, 2014 at 9:50 am
What about investment in future findings TOD? Five more good years versus 30 yr promising career ahead? Or versus 15 peak-productivity years of a mid-career.
LikeLike
March 9, 2014 at 6:11 pm
I’ve played with some of that age data at that link before. I estimate that the percentage of PIs aged 66+ was around 7% in 2010. As for the trend, it increased fairly steadily from 0.3% to 3% between 1981 and 1994. It was then essentially flat from 1994-1999. It’s been increasing since then with the increase having a steeper slope starting in 2005.
The other interesting part of these data is one can see a non-trivial increase in PIs who entered the system when they were between 40 and 50 during the budget doubling. They have remained in the system as they aged (at least until these data end in 2010). By eyeball, the number of PIs in the doubling bolus seem to have a greater impact on the age distribution of PIs than the slightly stretched age 66+ tail and the might be trying to remain in the system much longer.
LikeLike
March 9, 2014 at 7:10 pm
Putting on my old fart hat, eyeballing that graph there are fewer PIs today than when I got my first grant in 2003. I somehow doubt that claiming this as evidence for it being just as bad back in the old days, will be a popular opinion here.
LikeLike
March 9, 2014 at 9:33 pm
I would like to see the breakdown of the sequestered PIs- obviously Berg was estimating the excess PIs losing NIH funding, but I’d like to know the trends across age demos for the last 10 years or so (coming in and leaving). I expect it is getting much more broad (losses at all levels).
LikeLike
March 10, 2014 at 3:14 pm
Other Dave said: “Experience should matter in a meritocracy, right?… I think older people will still be in the system because they probably know what they’re doing.”
I’m sure older PIs know to work “the system” because they have more experience writing grants. However, writing a high-scoring grant doesn’t correlate with the quality of the science, as DrugMonkey posted a few weeks ago. Additionally, a lower percentage of newly-minted PhDs obtain tenure-track positions now than decades ago. Combine that with the higher number of PhDs awarded today, and there’s no evidence that younger investigators aren’t “really qualified.” In my department, the younger PIs (meaning upper 30s) are much more innovative than the old fogeys. Younger investigators get hit because a) institutions choose not to make new hires and b) aren’t protected with tenure.
LikeLiked by 1 person
March 10, 2014 at 6:30 pm
So, in a post a while ago, Sally Rockey said that the reason for increase in applications in the past decade was the number of applicants: https://nexus.od.nih.gov/all/2012/08/09/more-applications-many-more-applicants/ , https://nexus.od.nih.gov/all/2013/04/26/more-on-more-applicants/. According to this plot, the number of funded researchers has remained flat.
The extreme possible explanations are that NIH is in full RIRO mode (researcher-in-researcher-out, no one gets renewed) or full GTOL (get off my lawn, only researchers are renewed). Reality is likely somewhere in between in this spectrum. But there is a clear compromise between providing stable careers to PIs or going with full-on meritocracy. Of course, this is made worse by the bad labor incentives in this system.
Given the plateau in the number of people with grants and the fact that grants employ mostly trainees that hope one day to get a grant, this system is a pyramid scheme that lost its capacity to pay off around 2000, but we trainees are too dumb and only realize that when we get to the first postdoc (when you’re writing your own first grant). Gah, I’m bitter.
LikeLike
March 12, 2014 at 4:52 pm
I believe the biggest growth has been in R21s rather than more unusual mechanisms. There were fewer than 541 competing R21 awards in 2000 and 1771 competing R21 awards in 2013. I would guess that many folks with an R21 have no other support, particularly compared with other mechanisms.
LikeLiked by 1 person
March 12, 2014 at 5:14 pm
well now there’s a depressing thought, JB.
LikeLike
March 12, 2014 at 6:44 pm
But the disparity between R01 equivalents and all RPGs is closer to 5000 not 1000. Ie, R21s can’t be more than about 20% of that growth.
So the big mechs eat the big money, is the conclusion I reach. Color me shocked…
LikeLike
March 13, 2014 at 1:36 am
Don’t forget the R00s are in there too* DJMH, also this is number of PIs and not $$ amounts.
But…yeah.
*which is weird considering R23/R29 are in the R01-equiv pool.
LikeLike
March 13, 2014 at 3:10 am
DM and DJMH: To clarify my previous comment I should have included both noncompeting and competing R21s (I listed only competing). There were a total of 905 R21s in 2000 and 3773 in 2013. Thus, R21s could account for approximately 50% of the growth. I am not saying that this is all there is to the story but both NIH and the community embraced R21s over this period of time. When I was at NIGMS we stopped participating in the R21 parent announcement because (1) the reviews and scores frequently did not match (e.g. high risk exciting project with no preliminary data and bad score or lots of preliminary data and good score) and (2) we felt the funds could be better spent on R01s with longer duration.
LikeLike
March 13, 2014 at 3:21 am
Ok, back to being depressed. R21-only awardees increasing? What’s ahead, the great R03 expansion?
LikeLike
March 13, 2014 at 6:01 am
Oh, ok, thanks for clarifying.
LikeLike
March 13, 2014 at 5:36 pm
Where do R37’s stand in this mix? I’d bet that’s been climbing too, but. Shouldnt that be separated from the R01 counts?
LikeLike
March 13, 2014 at 8:13 pm
I don’t see that. The R37 *is* an R01…it replaces one and possibly is returned to R01 again later.
LikeLike
March 14, 2014 at 8:12 am
I agree that the R37s absolutely should be classified with R01s. The number has actually fallen from 820 total awards in 2000 to 625 total awards in 2013.
LikeLike
March 15, 2014 at 1:11 pm
Is there a discrepancy between number of PIs and number of funded projects? How much of the increase in number of PIs might be due to an increase in number of PIs per project?
Just wondering, ’cause it seems like I see fewer single-PI proposals lately.
LikeLike
March 16, 2014 at 8:39 am
I recently got busted on, somewhat randomly given the proposal, for not including enough other faculty level investigators. I am not sure what to make of this, should it become a trend.
LikeLike
March 18, 2014 at 4:06 pm
DM – I also got dinged for not including big effing deals at my institute on an R21. It was like a coattail tax I’m not willing to pay. After reading Berg’s book, this blog, and past experience, I have no desire to waste time on 2-year awards anymore. They don’t provide the money or time to do good work. The success rates are low, they are not renewable, and as previously mentioned, the review criteria (in practice) all over the place. In my (newbie) opinion, NIH should just get rid of them. I have to get my first R01 in the next 12 months or I’ll become a well-educated ski bum. SRG meets today for my first R01 app.
LikeLike
March 21, 2014 at 5:44 am
Glad to see all this analysis of the PI numbers. As for The Other Dave’s question about number of PIs– Note that NIH began allowing multiple PIs on a grant after 2006. This may explain the rise in PIs around 2007-2008 (not stimulus money–those grants aren’t included here). So if not for those multiple PIs, the line would probably have been flatter before the 2013 drop. This is my guess, anyway–Jeremy or NIH would know better.
LikeLike
March 24, 2014 at 4:22 pm
NIH is increasing the number of PIs / grant to keep the stats reasonable:
http://grantome.com/blog/research-dollars-divided
(Nowadays, almost 20% of PIs are funded through multi-PI Rxx grants; a decade ago the number was close to 0)
LikeLike